What is RaceInsights?
RaceInsights is like a custom Google Analytics designed specifically for endurance events. You can find your RaceInsights reports right on your event dashboard – dive in to learn how to get your data to work for you.
Overview Reports
Your Overview Report is the first set of graphs and numbers on your dashboard. The top graph shows you the pattern of conversions on your site (defaulting to the previous 7 days, but with customizable date ranges).
What Conversions Does RaceInsights Track?
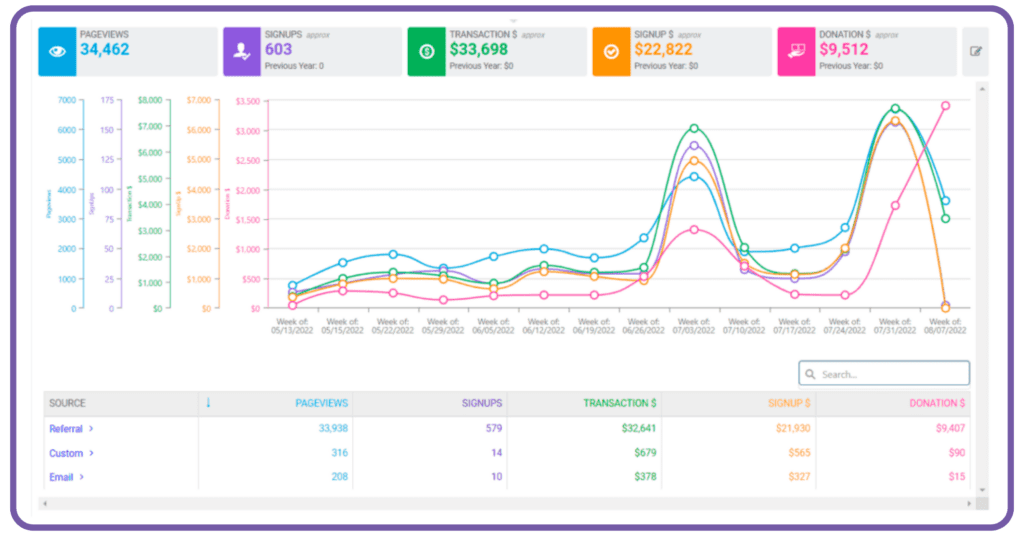
What Are Your Data Sources?

Track Every Marketing Action with Custom Source Tracking
Custom source tracking lets you create a unique link to your race website that can be shared for a specific marketing action – allowing you to track the exact results of every action. For example, you can create unique links for each Facebook Ad, partner email blast, and ad in your local event calendar to see how much interest and action each item takes. Make it even easier to understand your ROI by adding your budget (where applicable).

Set up of Custom Source Tracking is easier than you think – learn how to create your custom links in seconds here.
Reports for comprehensive data on your event…
Transaction Reports
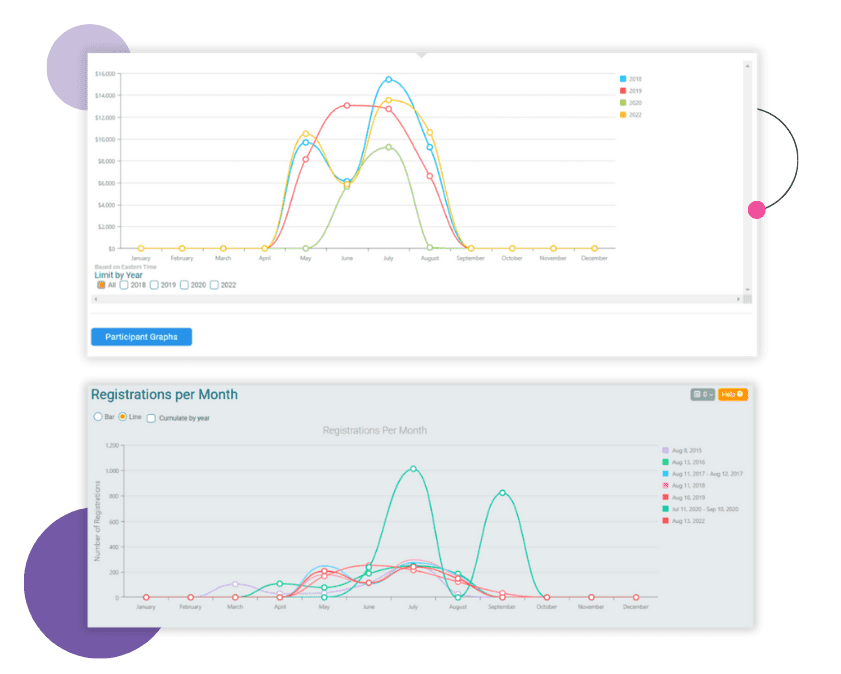
Transaction reports show you your year-over-year transactions to help you understand how your current transactions map onto previous patterns.
It’s not just transactions, though. From this page, you can also link to Participant Graphs that show you a similar year-over-year comparison of your registrations.
Promotion Reports
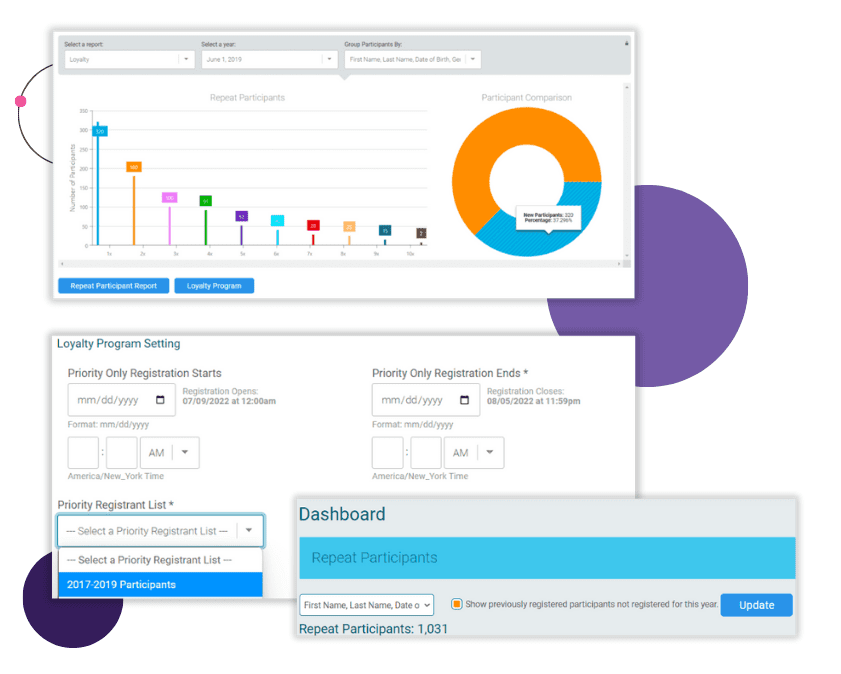
This set of reports breaks down the results of two key marketing efforts and provides the basis to improve participant loyalty by targeting previous participants.
The real power of this report is those buttons at the bottom, though.
The Repeat Participant Report shows you a downloadable list of all your repeat participants (and how many times they’ve returned) so you can make a custom reach-out to your most loyal fans. Want to target the ones who haven’t come back? There’s a checkbox at the top of the top of the report to show previous participants who haven’t yet joined this year.
The Loyalty Program lets you take action on your loyalty lists by linking you to the set up for a loyalty program. A loyalty program lets you open up registration to your previous participants before the general public – rewarding and incentivizing your fans.
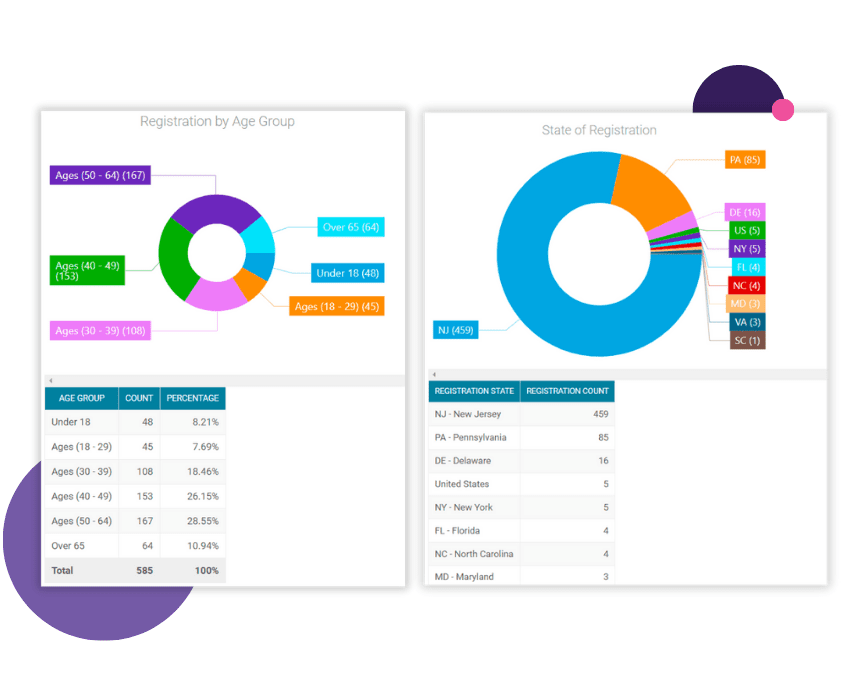
Demographic Reports
Most of these reports are exactly what they sound like: a quick snapshot of the demographic profile of your event. Analyze data by:
- Age
- Gender
- City
- State
- Country
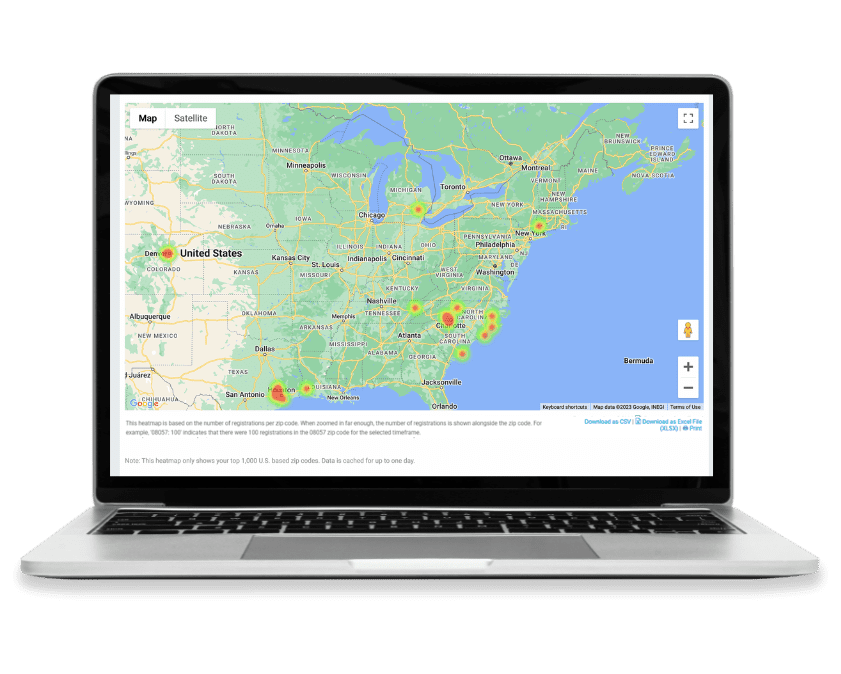
Heat Map
The Heat Map is the most actionable report amongst these. While it pulls up a fun map view of where all your participants originate, the true power is in the export at the bottom. From there, you can use the zip codes to learn more about where your participants originate – and make better decisions about what regions you want to target all your advertising money.
Registration Reports
The final set of reports on your dashboard are your Registration Reports. For many of these, there are downloadable, comprehensive versions of these reports to utilize. However, these versions give you a quick snapshot of your registration trends


Knowing your Data
Learn how to understand the reports within your RaceInsights and leverage the data collected.
Looking for More Reports?
Customer Spotlight
Autism Society of Central Virginia
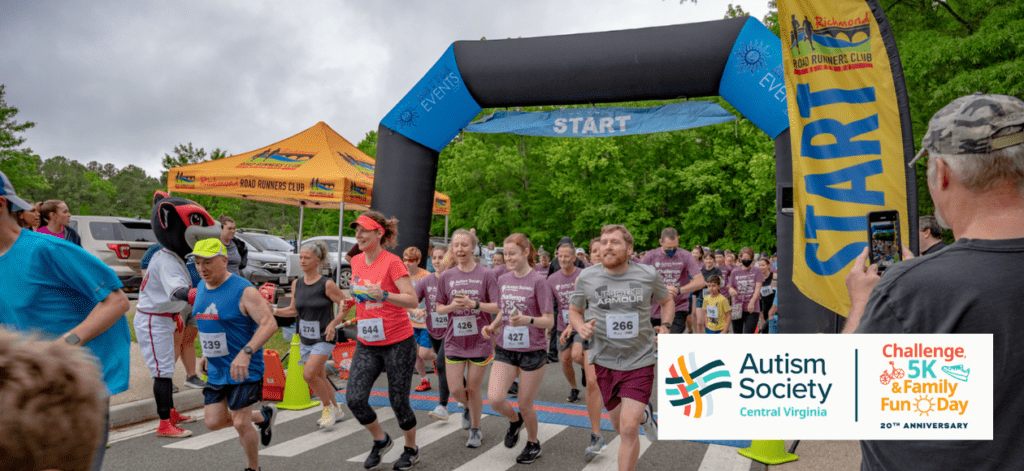
Most running, walking, and cycling events serve a fundraising function for important services to support our communities like the Autism Society of Central Virginia’s 5K Challenge. ASCV has multiple ways its raises funds to support its growing programs, and reports that their 5K challenge is its largest annual fundraiser. ASCV held a 30-day challenge from April 14 to May 14, and capped it off with their 5K and Family Fun day on May 14 where they were able to celebrate the event’s 20th anniversary and attract 1,200 registrants.
1,200 Registrants
30 Day Challenge
$2,500 Fundraising Incentives


